The Income by Item report shows which products were sold over a selected date range, grouped and sub-totaled by Product Category. This is an accrual-based report, helpful for identifying your top-performing products and evaluating your overall product mix.
The data is calculated based on how you've set up your Product Categories. For help organizing your Product Categories, see this article:
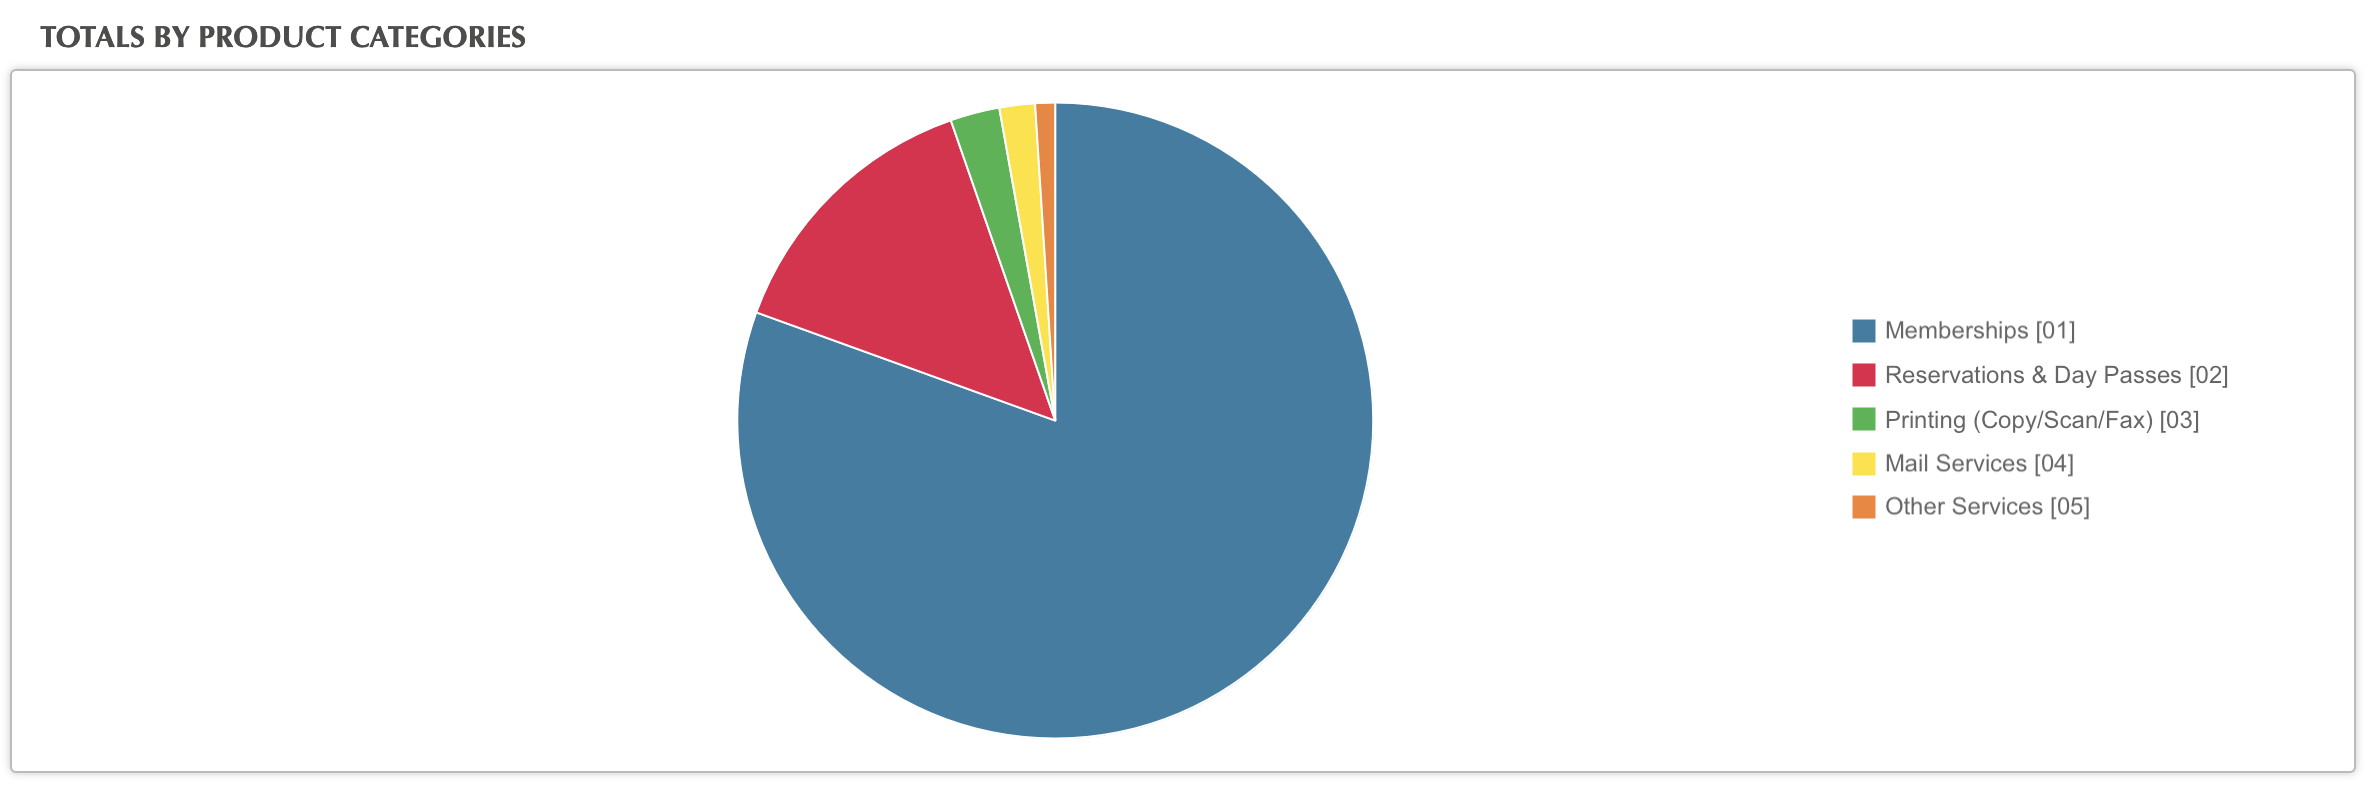
The Pie Chart at the top of the page gives you a visual representation of what’s selling. Click in any pie slice to dig deeper. You can go to 3 or 4 levels, eventually seeing exactly which clients have purchased a product.
Note: This is not a cash-based report. To see payments received, use the Income Report.Task URL: income-by-item-report
Was this article helpful?
That’s Great!
Thank you for your feedback
Sorry! We couldn't be helpful
Thank you for your feedback
Feedback sent
We appreciate your effort and will try to fix the article